Line Graphs
A Line Graphs interaction displays a line graph the student can edit. Line graphs may display various objects, such as points, lines, curves, polygons, and regions.
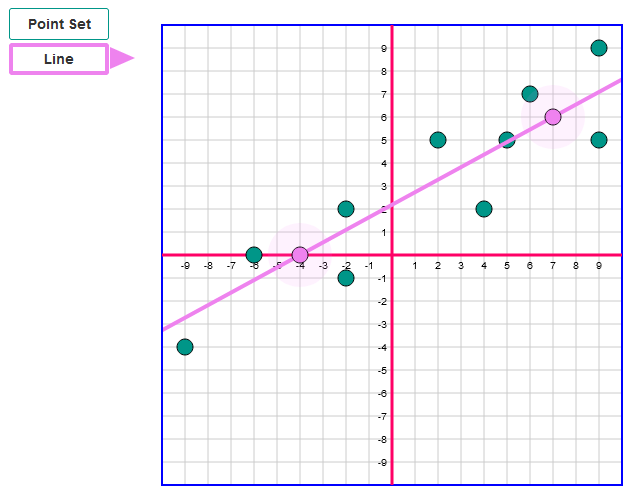
Figure 75: Graph Interaction: Line Graphs
Each object belongs to a layer that is superimposed on the plot area consisting of a grid with two axes. Each layer can only contain a single type of object, and each layer is separate.
Depending on the graph functionality, a layer may be editable by the student, read-only, or mixed (that is, partially editable). The student can select from multiple layers using buttons, with the currently selected layer appearing in front, and can interact with one editable or mixed layer at a time in order to form their response. Ways for students to interact with layers include adding points, selecting regions, and positioning parabolic curves. The student cannot edit plot area properties like dimensions or grid lines.
There are two graph functionalities:
- Multi-layer: This commonly used functionality allows the student to interact with one or more editable layers. For example, you could ask the student to draw a scatter plot and then, in a separate layer, draw the line of best fit, as in Figure 75.
- Layer Selection: This less commonly used functionality allows the student to choose a single layer out of a predefined set and interact with it by repositioning an existing object. For example, you could ask the student to decide whether a straight line or a parabola is more appropriate for a given equation, then to position the automatically provided line or parabola in their chosen layer. Note that if the student switches from one layer to another, their work on the initial layer is erased.
Layer types are as follows. Some of them are only available with the multi-layer functionality.
-
Point Set: A set of points.
-
Line Segment: A straight line connecting two points.
-
Line: A straight line crossing the graph, defined by two points.
-
Circle: A circle defined by two points at the center and the circumference.
-
Multiline: Straight lines connected by points.
-
Polygon: A polygon defined by points.
-
Absolute Value: A representation of an absolute value equation defined by two points.
-
Exponential: An exponential curve defined by two points.
-
Parabola: A parabola defined by two points.
-
Region Set: Regions defined by one or more lines (drawn by either the user or the student) existing in a separate Line layer. The student may select any of the regions.
-
Sinusoid: A sinusoid defined by two points.
-
Logarithmic: A logarithmic curve defined by two points.